I’ve spent the last 6 months working on our DNS infrastructure, wrangling it into a more modern shape.
This is the first in a series of articles talking about some of the process we’ve been through and outlining some of the improvements we’ve made.
One of the exercises we try to go through when designing any new production infrastructure is capacity planning. There are four questions you need to be able to ask when you’re doing this:
- How much traffic do we need to handle today?
- How are we expecting traffic to grow?
- How much traffic can the infrastructure handle?
- How much headroom have we got?
We aim to be in a position where we can ask those four questions on a regular basis, and preferably get useful answers to them!
When it comes to DNS, the most useful metric would appear to be “queries/second” (which I’ll refer to as qps from here on in to save a load of typing!) and bind can give us that information fairly readily with it’s built in statistics gathering features.
With that in mind, lets look at those 4 questions.
1. How much traffic do we need to handle today?
The best way to get hold of that information is to collect the qps metrics from our DNS infrastructure and graph them.
This is quite a popular thing to do and most monitoring tools (eg nagios, munin or ganglia) have well worn solutions available, and for everything else there’s google
Unfortunately we weren’t able to collate these stats from the core of the legacy DNS infrastructure in a meaningful way (due to differences in bind version, lack of a sensible aggregation point etc)
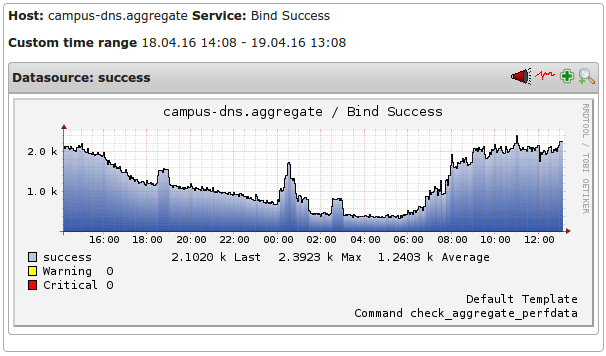
Instead, we had to infer it from other sources that we can/do monitor, for example the caching resolvers we use for eduroam.
Our eduroam wireless network is used by over 30,000 client devices a week. We think this around 60% of the total devices on the network, so it’s a fairly good proxy for the whole university network.
We looked at what the eduroam resolvers were handling at peak time (revision season), doubled it and added a bit. Not a particularly scientific approach, but it’s likely to be over-generous which is no bad thing in this case!
That gave us a ballpark figure of “we need to handle around 4000qps”
2. How are we expecting traffic to grow?
We don’t really have long term trend information for the central DNS service due to the historical lack of monitoring.
Again inferring generalities from eduroam, the number of clients on the network goes up by 20-30% year on year (and has done since 2011) Taking 30% growth year on year as our growth rate, and expanding that over 5 years it looks like this:
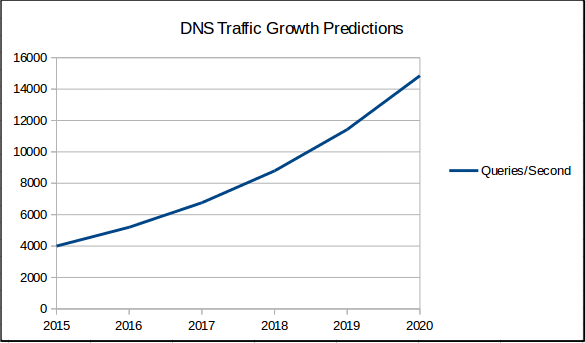
Or in 5 years time we think we’ll need around 15,000qps.
All estimates in this process being on the generous side, and due to the compound nature of the year-on-year growth calculations, that should be a significant overestimate.
It will certainly be an interesting figure to revisit in 5 years time!
3. How much traffic can the infrastructure handle?
To answer this one, we need some benchmarking tools. After a bit of research I settled on dnsperf. The mechanics of how to run dnsperf (and how to gather a realistic sample dataset) are best left for another time.
All tests were done against the pre-production infrastructure so as not to interfere with live traffic.
Lets look at the graphs we get out at the end.
The new infrastructure:
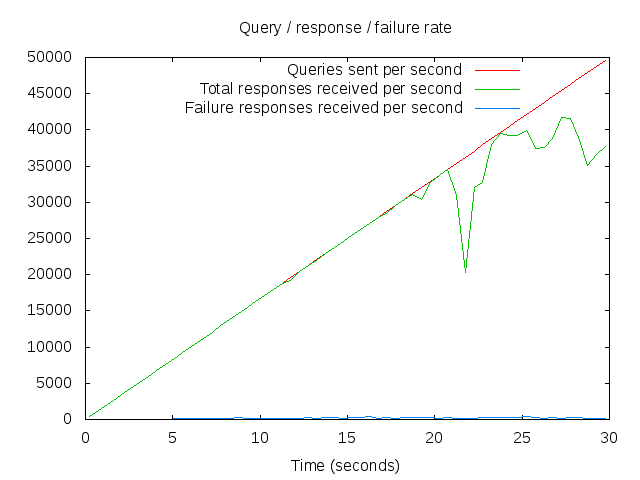
Interpreting this graph isn’t immediately obvious. The way dnsperf works is that it linearly scales the number of queries/second that it’s sending to your DNS server, and tracks how many responses it gets back per second.
So the red line is how many queries/second we’re testing against, and the green line is how the server is responding. Where the two lines diverge shows you where your infrastructure starts to struggle.
In this case, the new infrastructure appears to cope quite well with around 30,000qps – or about twice what we’re expecting to need in 5 years time. That’s with all (or rather, both!) the servers in the pool available, so do we still have n+1 redundancy?
A single node in the new infrastructure:
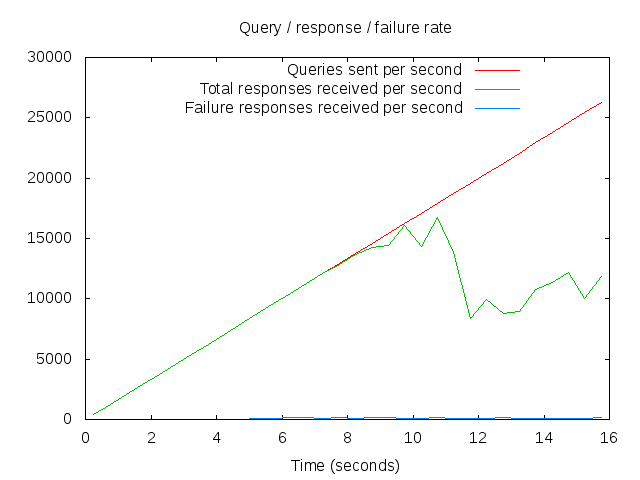
From this graph you can see we’re good up to around 14000qps, so we’re n+1 redundant for at least the next 3-4 years (the lifetime of the harware we’re using)
At present, we have 2 nodes in the pool, the implication from the two graphs is that it does indeed scale approximately linearly with the number of servers in the pool.
4. How much headroom have we got?
At this point, the answer to that looks like “plenty” and with the new infrastructure we should be able to scale out almost linearly by adding more servers to the pool.
Now that we know how much we can expect our infrastructure to handle, and how much it’s actually experiencing, we can make informed decisions about when we need add more resources in order to maintain at least n+1 redundancy.
What about the legacy infrastructure?
Well, the reason I’m writing this post today (rather than any other day) is that we retired the oldest of the servers in the legacy infrastructure today, and I wanted to fire dnsperf at it, after it’s stopped handling live traffic but before we switch it off completely!
So how many queries/second can a 2005 vintage Sun Fire V240 server cope with?
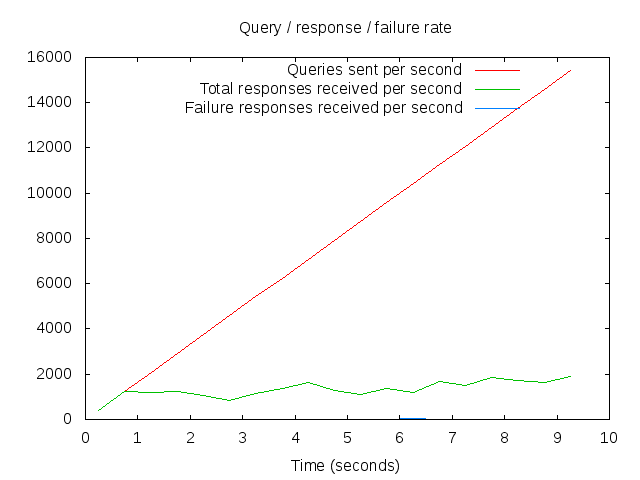
It seems the answer to that is “not really enough for 2015!”
No wonder its response times were atrocious…