TCP SACK PANIC (CVE-2019-11477/11478/11479) mitigation via Puppet

Redhat have provided a nice write-up here : https://access.redhat.com/security/vulnerabilities/tcpsack and this includes mitigations which you can use for until you can reboot hosts to use a newer kernel including the required patch.

Here’s a Puppet manifest which enables those mitigations (requires module herculesteam/augeasproviders_sysctl from the Puppet Forge) :

# CVE-2019-11477 fix until reboots can occur
# https://access.redhat.com/security/vulnerabilities/tcpsack for description and mitigations

class profile::security_workarounds::cve_2019_11477 {
  sysctl { 'net.ipv4.tcp_sack':
    ensure  => present,
    value   => '0',
    persist => true,
    comment => 'Mitigate issue CVE-2019-11477 and CVE-2019-11478 via sysctl',
  }

  # iptables can also mitigate CVE-2019-11479
  #iptables -I INPUT -p tcp --tcp-flags SYN SYN -m tcpmss --mss 1:500 -j DROP
  firewall { '009 drop new connections with low MSS sizes (CVE-2019-11477,11478,11479)':
    chain     => 'INPUT',
    proto     => 'tcp',
    action    => 'drop',
    tcp_flags => 'SYN SYN',
    mss       => '1:500',
  }
  #ip6tables -I INPUT -p tcp --tcp-flags SYN SYN -m tcpmss --mss 1:500 -j DROP
  firewall { '009 ipv6 drop new connections with low MSS sizes (CVE-2019-11477,11478,11479)':
    chain     => 'INPUT',
    proto     => 'tcp',
    action    => 'drop',
    tcp_flags => 'SYN SYN',
    mss       => '1:500',
    provider  => 'ip6tables',
  }
}

You can of course pick between the `sysctl` and `iptables` versions as necessary for your environment, but the sysctl version doesn’t mitigate against CVE-2019-11479.

Obviously, the best long-term solution is still to upgrade the kernel!

Dell C6145 (and presumably other Dell Cloud hosts) IPMItool BMC setup commands

Upgrading the BMC firmware on these hosts resets the settings to default (argh!), which includes:

  • Setting to DHCP for IP source
  • Losing the static IP, netmask and default gateway settings
  • Switching to a “shared” NIC rather than dedicated
    • (This doesn’t appear to be “use dedicated then fall back if not”, just straight to “shared”…)


Unfortunately, the various Dell docs don’t make this clear, nor exactly which ipmitool commands to run on a C6145 to set the BMC back to “dedicated” network port usage.

I haven’t tried these on any other Dell Cloud models yet (e.g. C5000, C8000), so I don’t know if they work at all!  Use them at your own risk!


Resetting the BMC IP setup is fairly straightforward:

# ipmitool lan set 1 ipsrc static
# ipmitool lan set 1 ipaddr 1.2.3.4
# ipmitool lan set 1 netmask 255.255.255.0
# ipmitool lan set 1 defgw ipaddr 1.2.3.250

Then printing the current config shows the expected configuration:

# ipmitool lan print 1
Set in Progress         : Set Complete
Auth Type Support       : MD2 MD5 PASSWORD
Auth Type Enable        : Callback : MD2 MD5 PASSWORD
                        : User     : MD2 MD5 PASSWORD
                        : Operator : MD2 MD5 PASSWORD
                        : Admin    : MD2 MD5 PASSWORD
                        : OEM      : MD2 MD5 PASSWORD
IP Address Source       : Static Address
IP Address              : 1.2.3.4
Subnet Mask             : 255.255.255.0
MAC Address             : 00:01:02:03:04:05
SNMP Community String   : public
IP Header               : TTL=0x40 Flags=0x40 Precedence=0x00 TOS=0x08
BMC ARP Control         : ARP Responses Enabled, Gratuitous ARP Disabled
Gratituous ARP Intrvl   : 2.0 seconds
Default Gateway IP      : 1.2.3.250
Default Gateway MAC     : 00:00:00:00:00:00
Backup Gateway IP       : 0.0.0.0
Backup Gateway MAC      : 00:00:00:00:00:00
802.1q VLAN ID          : Disabled
802.1q VLAN Priority    : 0
RMCP+ Cipher Suites     : 0,0,0
Cipher Suite Priv Max   : uaaaXXXXXXXXXXX
                        :     X=Cipher Suite Unused
                        :     c=CALLBACK
                        :     u=USER
                        :     o=OPERATOR
                        :     a=ADMIN
                        :     O=OEM


However, this doesn’t cover (or display in these settings…) the shared/dedicated setting for the BMC port.

You can find that by running this “raw” ipmitool command:

# ipmitool raw 0x34 0x14
 01

..where 01 means dedicated and 00 means shared.  (In this example we’re obviously already set to dedicated as this is after the fact)

In our case we want dedicated, which is set with this “raw” command:

# ipmitool raw 0x34 0x13 0x01
 01

Then the status command should show 01 as above and the dedicated BMC port will be in use.


Then go ahead and reset the BMC with this command:

# ipmitool mc reset cold
Sent cold reset command to MC

This will take a couple of minutes before the BMC is contactable again, but then it should be using the dedicated interface rather than shared, and you can go about your business again, huzzah!


Other possibly-useful ipmitool commands


References:

Automatic patching

Services being broken by automatically installing bad updates from the package manager is an issue that sysadmins have been mulling over for years. The knee-jerk reaction is to disable automatic updates, but this doesn’t avoid the problem. You still have to apply the updates sooner or later, and doing updates manually is ever more tedious as admins look after larger and larger fleets of virtual machines. Not patching at all is also not an option, for obvious security reasons and also for compliance with ISP-11 which mandates that security updates must be applied within 5 days.

The “gold standard” solution that everyone dreams of is to use a gated repo – i.e. you have a local “dirty” repo which syncs from upstream every night, and all of your dev/test machines update against this repo. Once “someone” has done “some” testing, they can allow the known-good updates into the clean repo, which the production machines update from. The trouble is, this is actually quite a lot of work to set up, and requires ongoing maintenance to test updates. It’s still very human-intensive, and sysadmins hate that.

So what else can be done? People often talk about a system where your dev servers patch nightly and your prod servers patch weekly, but this doesn’t help you if the broken update comes out on prod patching day.

We’ve recently started using a similar regime where dev/test servers patch nightly, but there’s a tweak with prod. All our prod servers are split into a class (dev, test, prod, etc) and one of three groups according to the numbers in their structured hostname. We classify nodes using a Puppet module called uob_classifier. Here’s an example:

[ispms@db-mariadb-p0 ~]$ sudo facter -p uob_service_class
prod
[ispms@db-mariadb-p0 ~]$ sudo facter -p uob_service_tier
1

Anything that for some reason slips through the automatic classification isn’t forgotten – the classifier assumes it is production group 1.

We then use these classes and groups to decide when to patch each type of box. Here’s the Puppet profile we use to manage yum updates with a Forge module, jgazeley/yumupdate.

# Profile for yum updates
class profile::yumupdate {

  # If it's prod, work out what day we should patch
  # to keep clusters patched on different days
  if ($::uob_service_class == 'prod') {
    $prodday = $::uob_service_tier ? {
      '1'     => ['1'],
      '2'     => ['2'],
      '3'     => ['3'],
      default => ['4'],
    }
  }

  # Work out what day(s) to patch for non-prod nodes
  $weekday = $::uob_service_class ? {
    'prod'  => $prodday,
    'dev'   => ['1-5'],
    'test'  => ['1-5'],
    'beta'  => ['1-5'],
    'demo'  => ['1-5'],
    default => ['1-5'],
  }

  # jgazeley/yumupdate
  class { '::yumupdate':
    weekday => $weekday,
  }
}

In our environment, production groups 1-3 patch on Mondays, Tuesdays or Wednesdays respectively. Anything that is designated production but somehow didn’t get a group number patches on Thursdays. Dev/test/etc servers patch every weekday.

We don’t know what day of the week patches will be released upstream, so this is still no guarantee that dev servers will install a particular patch before production. However it does mean that not all production servers will break on the same day if there is a bad update – we will have enough time to halt further updates if one server breaks due to a bad update.

It’s certainly not a perfect solution, but it avoids most of the risk surrounding automatic patching and is also very quick and simple to implement.

Getting to grips with GitLab CI

Background

Continuous Integration (CI) refers to the concept of automatically testing, building and deploying code as often as possible. This concept has been around in the world of software development for some time now, but it’s new to sysadmins like me.

While the deliverables produced by developers might be more tangible (a mobile app, a website, etc), with the rise of infrastructure as code, sysadmins and network admins are increasingly describing the state of their systems as code in a configuration management system. This is great, as it enables massive automation and scaling. It also opens the door for a more development-like workflow, including some of the tools and knowledge used by developers.

This article describes our progress using a CI workflow to save time, improve quality and reduce risk with our day-to-day infrastructure operations.

Testing, testing…

The Wireless team have used the Puppet configuration management system for several years, for managing server infrastructure, deploying applications and the suchlike. We keep our code in GitLab and do our best to follow best practice when branching/merging. However, one thing we don’t do is automatic testing. When a branch is ready for merging we test manually by moving a test server into that Puppet environment, and seeing if it works properly.

GitLab CI

The IT Services GitLab server at git.services.bristol.ac.uk now provides the GitLab CI service, which at its simplest is a thing that executes a script against your repository to check some properties of it. I thought I would start off simple and write some CI tests to be executed against our Puppet repo to do syntax checking. There are already tools that can do the syntax checking (such as puppet-lint), so all I need to do is write a CI test that executes them.

There’s a snag, though. What is going to execute these tests, and where? How are we going to ensure the execution environment is suitable?

GitLab CI runs on the GitLab server itself, but it executes CI tests in CI runners. Runners can be hosted on the GitLab server, on a different server or in the cloud. To start off simple, I created a new VM to host a single CI runner. So far so good, but the simplest possible runner configuration simply executes the CI tests in a shell on the system it is running on. Security concerns aside, this is also a bad idea because the only environment available is the one the runner is hosted on, and what if a CI test changes the state of the environment? Will the second test execute in the same way?

Docker

This is where Docker steps in. Docker is a container platform which has the ability to create and destroy lightweight, yet self-contained containers on demand. To the uninitiated, you could kind-of, sort-of think of Docker containers as VMs. GitLab CI can make use of Docker containers to execute CI tests. Each CI test is executed in a factory-fresh Docker container which is destroyed after the test has completed, so you can be sure of consistent testing, and it doesn’t matter if you accidentally break the container. The user can specify which Docker image to use for each test.

A real example

So far, this is all talk. Let me show you the components of the simple CI tests I’ve written for our Puppet control repo.

The CI config itself is stored in the root of your git repo, in a file called.gitlab-ci.yml. The presence of this file magically enables CI pipelines in your project. The file tells GitLab CI how to find a runner, which Docker image to use and what tests to execute. Let’s have a look at the config file we’re using for our Puppet repo:

# Docker image to use for these tests
image: git.services.bristol.ac.uk:4567/resnet/netops-ci:master

# Different stages in which to run tests. Only proceed to the
# next stage if the current one passes
stages:
  # check: syntax checking
  - check
  # style: linting
  - style

# Check Puppet syntax
puppet-parser:
  stage: check
  script:
    - tests/check-puppet-parser.sh
  only:
    - branches

# Check ERB template syntax
check-erb:
  stage: check
  script:
    - tests/check-erb.sh
  only:
    - branches

# Check YAML (Hiera) syntax
check-yaml:
  stage: check
  script:
    - tests/check-yaml.sh
  only:
    - branches

# Check Puppet linting style
puppet-lint:
  stage: style
  script:
    - tests/style-puppet-lint.sh
  only:
    - branches

All of the tests are executed in the same way: by calling shell scripts that are in the tests subdirectory of the repo. They have been sorted into two stages – after all, there’s no point in proceeding to run style checks if the syntax isn’t valid. Each one of these tests runs in its own Docker container without fear of contamination.

To give an idea of how simple these CI test scripts are, here’s the one we use to check Puppet syntax – it’s just a one-liner that finds all Puppet manifests in the repo and executes puppet parser validate against each one:

#!/bin/bash
set -euo pipefail

find . -type f -name '*.pp' -print0 | xargs -0 /opt/puppetlabs/bin/puppet parser validate

How CI fits with our workflow

In the configuration we are using, the test suite is executed against the codebase for every commit on every branch. It can also be configured only to run when tags are created, or only on the master branch, etc. For us, this decision is a reflection that we are using an interpreted language, there is no “build” stage and that every branch in the repo becomes a live Puppet environment.

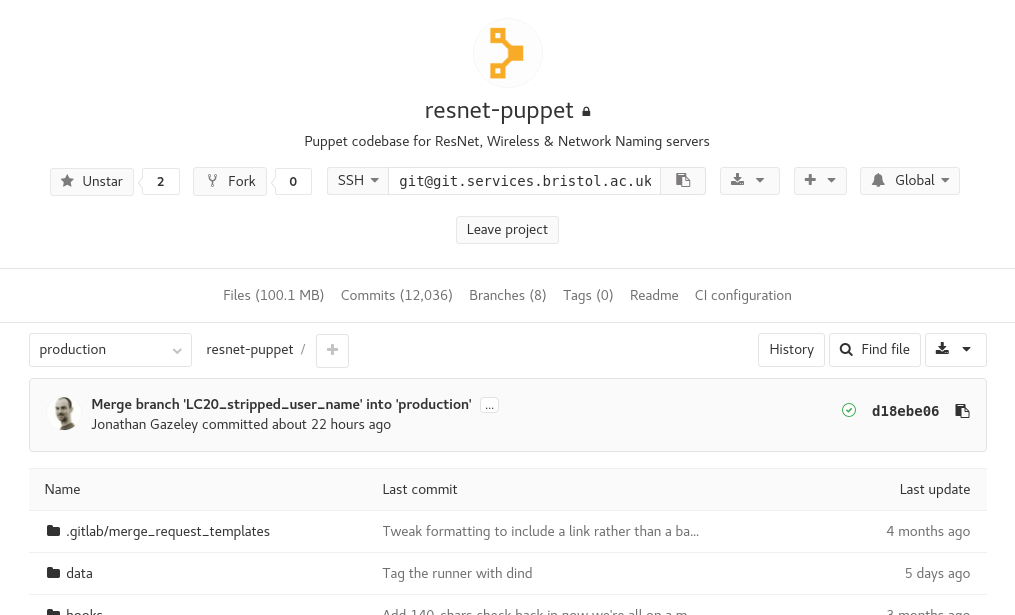
The tests are always run in the background and if they succeed, you get a little green tick at various places throughout the GitLab interface to show you that your commit, branch or merge request is passing (has passed the most recent test).

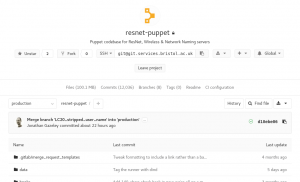
Project summary showing CI status OK

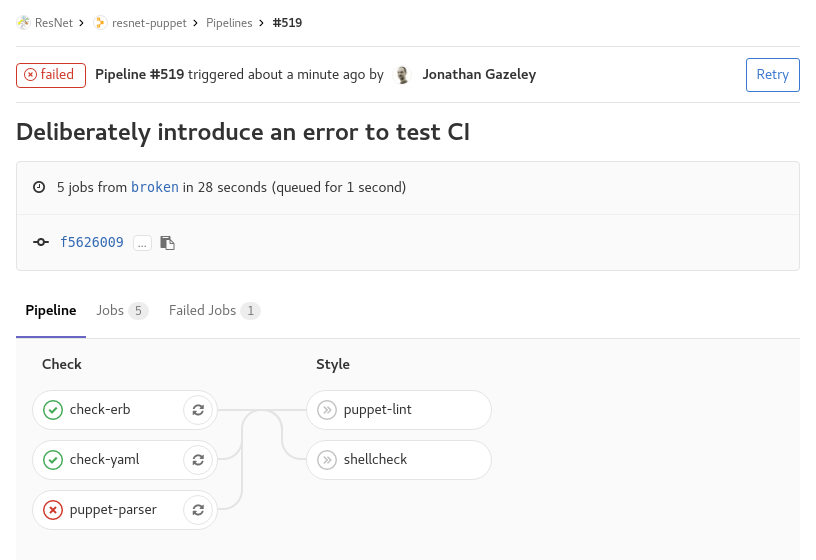
If, however, you push a bad commit that fails testing then you get an email, and all the green ticks turn to red crosses. You can drill down into the failed pipeline, see which specific tests failed, and what errors they returned.
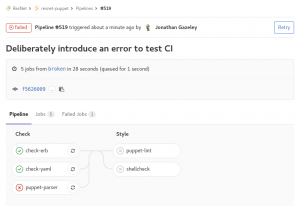
Failed tests

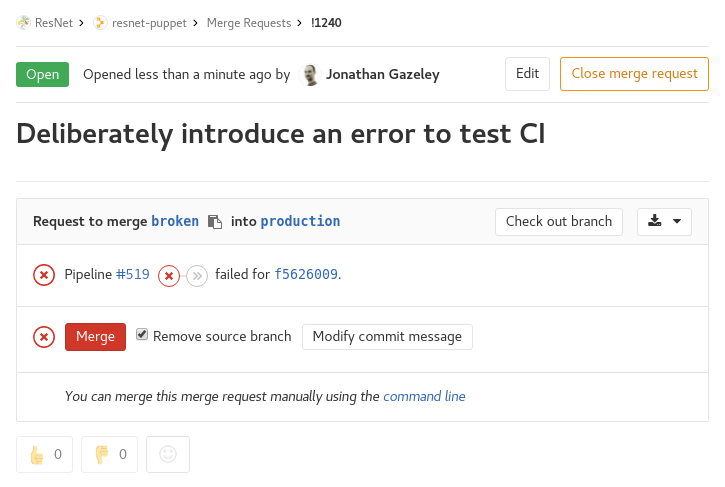
If you carry on regardless and create a merge request for a branch that is failing tests, it won’t let you accept that merge request without a dire warning.

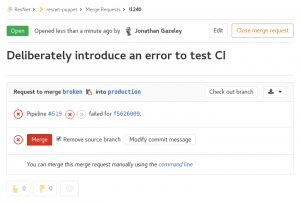
Merge request which failed CI tests

Combining the CI pipeline with setting your master or production branch to be a protected branch means it should be impossible to merge code that has syntax errors. Pretty cool, and a great way of decreasing risk when merging code to production.

I want to play!

Hopefully this article has shown how easy it is to get started running basic CI tests on GitLab CI with Docker. To make things even easier, I have created a repository of sample GitLab CI configs and tests. Have a wander over to the gitlab-ci repo and look at the examples I’ve shared. At the time of writing, there are are configs and tests suitable for doing syntax checks on Puppet configs, Perl/Python/Ruby/Shell scripts and Dockerfiles.

The repo is open to all IT Services staff to read and contribute to, so please do share back any useful configs and tests you come up with.

N.B At the time of writing, the GitLab CI service is provided by a small VM as a proof of concept so tests may be slow if too many people jump on this cool bandwagon. We are in the process of acquiring some better hardware to host CI runners.

As ever, we recommend all GitLab users join the #gitlab-users channel on Slack for informal support and service notifications.

Looking ahead

These CI tests are a simple example of using Docker containers to execute trivial tests and return nothing but an error code. In the future we will be looking to create more complex CI pipelines, including:

  • Functional tests, which actually attempt to execute the code and make sure it works as designed rather than just checking the syntax
  • Tests that return artefacts, such as a pipeline that returns RPMs after running rpmbuild to build them
  • Tests that deploy the end product to a live environment after testing it, rather than just telling a human operator that it’s safe to deploy

Migrating gitlab projects

If you’re migrating a gitlab project from one server to another, unless the two gitlab instances are the same major revision you may run into a couple of problems with the export/import procedure.

The first error you’re likely to hit is something like:

The repository could not be imported.
Error importing repository into pp-computing/todo-list - Import version mismatch: Required 0.1.8 but was 0.1.6

This is because whenever there is a potentially “dangerous” change to the import script, gitlab “fails safe” and refuses to import the project. If the two numbers are reasonably close together (and your project is straight forward enough that you can carefully check the users, permissions, wiki pages, issues and milestones etc then you can try this to pretend that your export tarball is newer than it really is:


mkdir project_export
tar xfv old_export_file.tar.gz -C project_export
cd project_export
echo '0.1.8' > VERSION
tar czf experimental_new_project_export.tar.gz *

If you have milestones in your project, you may hit another error if you’re migrating from a gitlab instance that is older than 9.5 is:


Error importing repository into my-group/my-project - Validation failed: Group milestone should belong either to a project or a group.

The workaround for this one appears to be to import your project into your personal gitlab space, and then “move” it to your group space.

If you hit any errors not covered in the above, let us know below!

(And don’t forget you’ll need to update your remotes in any checked out working copies you have!)

Rocks Clusters – the httpd update that breaks your cluster and how to fix it

I’ve had a cluster running Rocks 6.2 (Sidewinder) for a few months and it has been working well. I recently had a request to add a new user, so I created the account with a minimal useradd command specifying only the comment, the uid, the group and the username, then I ran the ‘rocks sync users’ command which copies various files, including /etc/passwd to the nodes and restarts some daemons.

A few hours later the user got back to me to say his jobs were queued, but not running. So I used the checkjob command to what the problem was, and found that his uid was unknown on the node. Indeed looking at the password file on the node, I saw that his account was not there. So I rebooted the node, and ran rocks sync users again, with no joy. So I set the node to rebuild on boot and rebooted it, and it came up with no user accounts at all.

There were errors like this in the log:

Jul 27 17:39:43 compute-0-8 411-alert-handler[13333]: Error: http://10.1.1.1:372/411.d/etc.auto..masterupdating Could not get file ‘http://10.1.1.1:372/411.d/etc.auto..master’: 400 Bad

The nodes get the password files amongst other things from the head node using the 411 service. So running the command below on the node should get all the files.

411get –all

however all I got was

Error: Could not get file ‘http://10.1.1.1:372/411.d//’: 400 Bad

I could ssh to a node and use wget to get the files successfully which caused me more confusion.

I had updated the head node recently, and this turned out to be my problem. I asked on the Rocks mailing list, and the answer I got was:

The latest CentOS 6 httpd update breaks 411.  To fix, add this to the
end of /etc/httpd/conf/httpd.conf and reload httpd:

HttpProtocolOptions Unsafe

So I did that, and now rocks sync users is working again. The version of http which caused the problem was httpd-2.2.15-60.el6.centos.4.x86_64

I’m putting this here in case anyone else gets hit by this.

Service availability monitoring with Nagios and BPI

Several times, senior management have asked Team Wireless to provide an uptime figure for eduroam. While we do have an awful lot of monitoring of systems and services, it has never been possible to give a single uptime figure because it needs some detailed knowledge to make sense of the many Nagios checks (currently 2704 of them).

From the point of view of a Bristol user on campus here, there are three services that must be up for eduroam to work: RADIUS authentication, DNS, and DHCP. For the purposes of resilience, the RADIUS service for eduroam is provided by 3 servers, DNS by 2 servers and DHCP by 2 servers. It’s hard to see the overall state of the eduroam service from a glance at which systems and services are currently up in Nagios.

Nagios gives us detailed performance monitoring and graphing for each system and service but has no built-in aggregation tools. I decided to use an addon called Business Process Intelligence (BPI) to do the aggregation. We built this as an RPM for easy deployment, and configured it with Puppet.

BPI lets you define meta-services which consist of other services that are currently in Nagios. I defined a BPI service called RADIUS which contains all three RADIUS servers. Any one RADIUS server must be up for the RADIUS group to be up. I did likewise for DNS and DHCP.

BPI also lets meta-services depend on other groups. To consider eduroam to be up, you need the RADIUS group and the DNS group and the DHCP group to be up. It’s probably easier to see what’s going on with a screenshot of the BPI control panel:

BPI control panel

BPI control panel

So far, these BPI meta-services are only visible in the BPI control panel and not in the Nagios interface itself. The BPI project does, however, provide a Nagios plugin check_bpi which allows Nagios to monitor the state of BPI meta-services. As part of that, it will draw you a table of availability data.

eduroam uptime

eduroam uptime

So now we have a definitive uptime figure to the overall eduroam service. How many nines? An infinite number of them! 😉 (Also, I like the fact that “OK” is split into scheduled and unscheduled uptime…)

This availability report is still only visible to Nagios users though. It’s a few clicks deep in the web interface and provides a lot more information than is actually needed. We need a simpler way of obtaining this information.

So I wrote a script called nagios-report which runs on the same host as Nagios and generates custom availability reports with various options for output formatting. As an example:

$ sudo /usr/bin/nagios-report -h bpi -s eduroam -o uptime -v -d
Total uptime percentage for service eduroam during period lastmonth was 100.000%

This can now be run as a cron job to automagically email availability reports to people. The one we were asked to provide is monthly, so this is our crontab entry to generate it on the first day of each month:

# Puppet Name: eduroam-availability
45 6 1 * * nagios-report -h bpi -s eduroam -t lastmonth -o uptime -v -d

It’s great that our work on resilience has paid off. Just last week (during the time covered by the eduroam uptime table) we experienced a temporary loss of about a third of our VMs, and yet users did not see a single second of downtime. That’s what we’re aiming for.

Making suexec work…

suexec is a useful way of getting apache to run interactive magic (cgi scripts, php scripts etc) with a different user/group than the one that apache is running as.

Most configuration guides tell you:

  • Add “SuexecUserGroup $OWNER $GROUP” to your apache config
  • Look in /var/log/httpd/suexec.log to see what’s going wrong

What they don’t tell you, is that suexec makes some assumptions about where to find things it will execute, and that you can’t guarantee that log location is consistent across distros (or even versions of the same distro). I’m setting this up on CentOS 7, so the examples below were produced in that environment.

You can get useful information about both of the above by running the following:

[myuser]$ sudo suexec -V
-D AP_DOC_ROOT="/var/www"
-D AP_GID_MIN=100
-D AP_HTTPD_USER="apache"
-D AP_LOG_SYSLOG
-D AP_SAFE_PATH="/usr/local/bin:/usr/bin:/bin"
-D AP_UID_MIN=500
-D AP_USERDIR_SUFFIX="public_html"
[myuser]$

AP_DOC_ROOT and AP_USERDIR_SUFFIX control which paths suexec will execute. In this case we’re restricted to running stuff that lives somewhere under “/var/www” or “/home/*/public_html”

If you’ve got content elsewhere (for example, an application which expects to be installed under /usr/share/foo/cgi-bin) then it’s not sufficient to put a symlink from /var/www/foo/cgi-bin to /usr/share/foo/cgi-bin as suexec checks the actual location of the file, not where it was called from.

This is sensible, as it stops you putting a symlink in place which points at something nasty like /bin/sh.

AP_GID_MIN and AP_UID_MIN limit which users/groups suexec will run stuff as. In this case it won’t run anything with a GID < 100 or a UID < 500. This is sensible as it stops you running CGI scripts as privileged system users.

The GID limit is probably not an issue, but the UID limit might cause wrinkles if you look after one of the 18 UoB users who have a centrally allocated unix UID that is under 500 (because they’ve been here since before that was a problem)[1]

AP_LOG_SYSLOG is a flag that says "send all log messages to syslog" – which is fine, and arguably an improvement over writing to a specific log file. It doesn’t immediately tell you where those messages end up, but I eventually found them in /var/log/secure… which seems a sensible place for them to end up.

Once you’ve got all that sorted, you’ll need to make selinux happy. Thankfully, that’s dead easy and can be done by enabling the httpd_unified boolean. If you’re using the jfryman/selinux puppet module, it’s as easy as:


selinux::boolean { 'httpd_unified': }

I think that’s all the bumps I’ve hit on this road so far, but if I find any more I’ll update this article.

-Paul
[1] but then again, if you look after them (or one of the 84 users whose UID is under 1000) you’re probably already used to finding odd things that don’t work!

RHEL 7.2 Authconfig follow up — don’t mix local user info with sssd!

Quick follow-up on my previous post about authconfig with more info.

So it turns out that this was intentional, and the change was made because 2-facter authententication support was added to SSSD.
This was added as a fix for RHEL bug 1204864, with the following comment:

With the current configuration pam_unix will always prompt the user for a password. Letting SSSD ask users of 2FA again for the password will lead to a bad user experience. Letting SSSD only ask for the second factor will make it hard for applications like gdm to show specific 2FA dialogs.

This means that if you use a mix of local (/etc/passwd or /etc/shadow) and remote (via sssd) user information for a particular user, then the user in question will only auth against their local password.
If they don’t have a local password then they will be unable to authenticate.

This seems a particularly odd thing to change during a point-release of RHEL, as I would expect that using a mix of local and remote user information is more common than using 2FA with sssd…

I thought this was worth stating separately from the previous post, as it’s more general than just when performing hackery to change UIDs — any local user entry will cause this to happen when used in conjunction with sssd.

Additional info:

The code in sssd which enforces this is as follows (from authconfig-6.2.8/authinfo.py in the current CentOS 7.x git sources, line 3812):

  # do not continue to following modules if authentication fails
  if name == "unix" and stack == "auth" and (self.enableSSSDAuth or
    self.implicitSSSDAuth or self.enableIPAv2) and (not self.enableNIS):
    logic = LOGIC_FORCE_PKCS11 # make it or break it logic

..so this is specifically for when you are using SSSD and not NIS, not any other remote authn/authz methods such as KRB5 without SSSD.

Rocks and /install directory on compute nodes

I noticed recently that some of our compute nodes were getting a bit short on disk space, as we have a fairly large set of (multiple versions of) large applications installed into /opt on each node rather than sharing those applications over NFS via /share/apps (which is apparently the usual Rocks way).

In looking at this I noticed that the /install directory on each compute node contained a complete copy of all packages installed during rebuild! In our case the /install directory was using about 35GB, mostly because of multiple versions of Matlab and Mathematica being installed (which are up to 10GB each now…).

Anyhow, to avoid this you can convert from using the <packages> XML tags in your extend-compute.xml file to using a post-install script (the <post> section) which calls yum install explicitly for the packages you want to install.
Be sure to also run yum clean packages regularly in the script, otherwise you’re just moving the packages from /install into the yum package cache in /var/cache/yum !

e.g. Convert this:

<package>opt-matlab-R2016a</package>

..into this:

<post>
yum install -y opt-matlab-R2016a
yum clean packages
</post>

This has allowed us to continue installing packages locally until we use up that extra 35GB 🙂