The eduroam wireless network has a reliance on a database for the authorization and accounting parts of AAA (authentication, authorization and accounting – are you who you say you are, what access are you allowed, and what did you do while connected).
When we started dabbling with database-backed AAA in 2007 or so, we used a centrally-provided Oracle database. The volume of AAA traffic was low and high performance was not necessary. However (spoiler alert) demand for wireless connectivity grew and before many months, we were placing more demand on Oracle than it could handle. The latency of our queries was taking sufficiently long that some wireless authentication requests would time out and fail.
First gen – MySQL (2007)
It was clear that we needed a dedicated database platform, and at the time that we asked, the DBAs were not able to provide a suitable platform. We went down the route of implementing our own. We decided to use MySQL as a low-complexity open source database server with a large community. The first iteration of the eduroam database hardware was a single second-hand server that was going spare. It had no resilience but was suitably snappy for our needs.
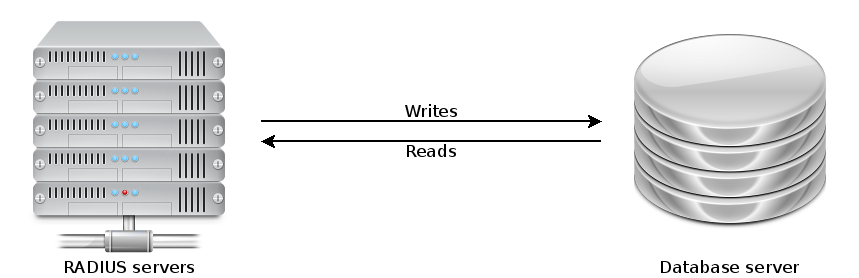
First gen database
Second gen – MySQL MMM (2011)
Demand continued to grow but more crucially eduroam went from being a beta service that was “not to be relied upon” to being a core service that users routinely used for their teaching, learning and research. Clearly a cobbled-together solution was no longer fit for purpose, so we went about designing a new database platform.
The two key requirements were high query capacity, and high availability, i.e. resilience against the failure of an individual node. At the time, none of the open source database servers had proper clustering – only master-slave replication. We installed a clustering wrapper for MySQL, called MMM (MySQL Multi Master). This gave us a resilient two-node cluster whether either node could be queried for reads and one node was designated the “writer” at any one time. In the event of a node failure, the writer role would be automatically moved around by the supervisor.
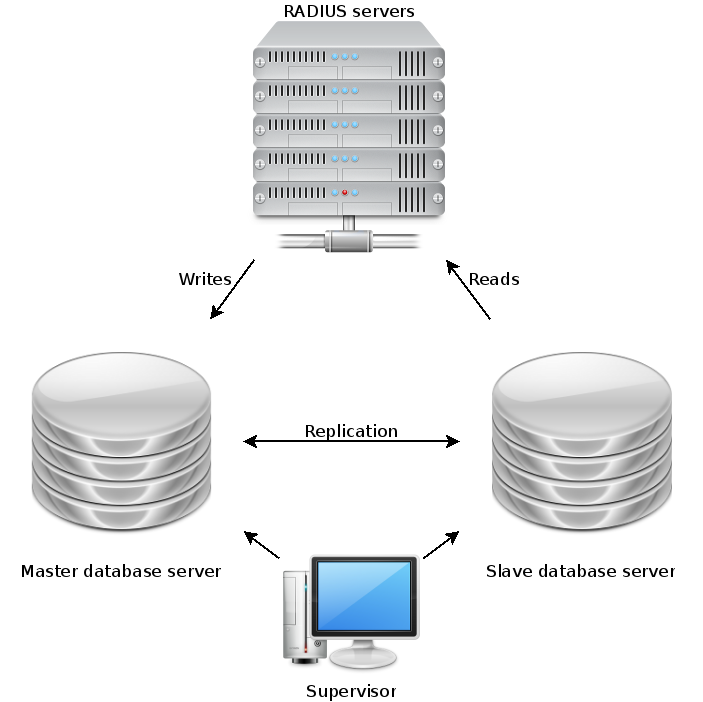
Second gen database
Not only did this buy us resilience against hardware faults, for the first time it also allowed us to drop either node out of the cluster for patching and maintenance during the working day without affecting service for users.
The two-node MMM system served us well for several years, until the hardware came to its natural end of life. The size of the dataset had grown and exceeded the size of the servers’ memory (the 8GB that seemed generous in 2011 didn’t really go so far in 2015) meaning that some queries were quite slow. By this time, MMM had been discontinued so we set out to investigate other forms of clustering.
Third gen – MariaDB Galera (2015)
MySQL had been forked into MariaDB which was becoming the default open source database, replacing MySQL while retaining full compatibility. MariaDB came with an integrated clustering driver called Galera which was getting lots of attention online. Even the developer of MMM recommended using MariaDB Galera.
MariaDB Galera has no concept of “master” or “slave” – all the nodes are masters and are considered equal. Read and write queries can be sent to any of the nodes at will. For this reason, it is strongly recommended to have an odd number of nodes, so if a cluster has a conflict or goes split-brain, the nodes will vote on who is the “odd one out”. This node will then be forced to resync.
This approach lends itself naturally to load-balancing. After talking to Netcomms about the options, we placed all three MariaDB Galera nodes behind the F5 load balancer. This allows us to use one single IP address for the whole cluster, and the F5 will direct queries to the most appropriate backend node. We configured a probe so the F5 is aware of the state of the nodes, and will not direct queries to a node that is too busy, out of sync, or offline.
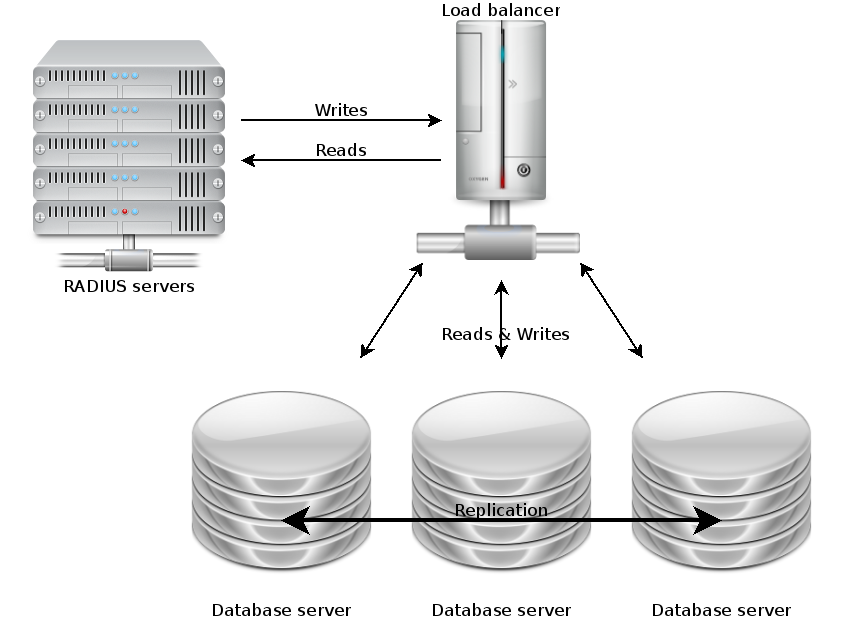
Third gen database
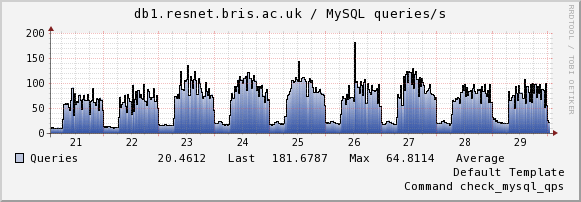
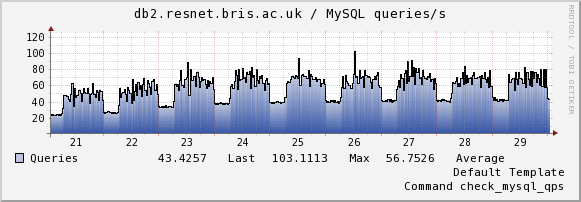
Having three nodes that can be simultaneously queried gives us an unprecedented capacity which allows us to easily meet the demands of eduroam AAA today, with plenty of spare capacity for tomorrow. We are receiving more queries per second than ever before (240 per second, and we are currently in the summer vacation!).
We are required to keep eduroam accounting data for between 3 and 6 months – this means a large dataset. While disk is cheap these days and you can store an awful lot of data, you also need a lot of memory to hold the dataset twice over, for UPDATE operations which require duplicating a table in memory, making changes, merging the two copies back and syncing to disk. The new MariaDB Galera nodes have 192GB memory each while the size of the dataset is about 30GB. That should keep us going… for now.