This year, eduroam is an interesting service. Not only has it been running on all-new Fog-based infrastructure since the mid-summer, but eduroam and ResNet Wireless have been merged to form one authenticated wireless network to rule them all with more users than ever before.
We’ve been watching how the servers are performing under load for the first time with great interest. Let’s have a look at some of the numbers. All of these graphs show the time from midnight on Saturday 21st September (UK freshers arrive) to midnight on Monday 30th September (end of weekend after freshers week).
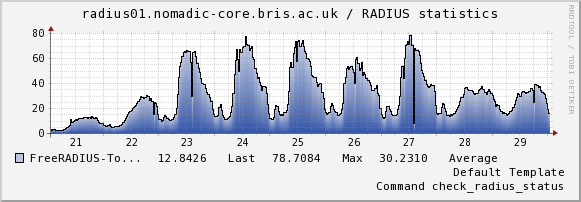
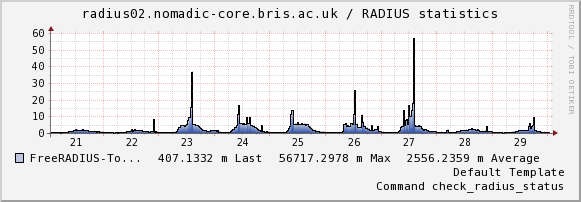
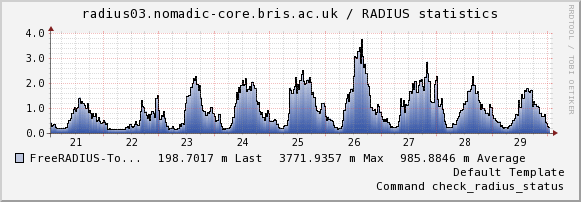
First let’s have a look at the graph of RADIUS authentication requests – scaled to show Access-Request packets received per second (not necessarily authentications per second, as one authentication usually constitutes several Access-Requests).
The gentle swell of users on the weekend of the 28th/29th is mostly undergraduates using eduroam in residences. The taller spikes on weekdays is made up by University staff using eduroam on campus.
radius01 usually serves eduroam users on campus, at Bristol – both Bristol students and visitors from other eduroam institutions. radius02 usually serves Bristol users who are visiting other institutions, while radius03 usually authenticates any user authenticating at eduroam hotspots in Bristol City Council buildings, and certain local hospitals. However the servers have got each other’s backs, and will take on additional roles at will if there’s an outage.
There are a couple of large spikes on the graph of radius02 with matching notches on the graph of radius01. These are times when the servers decided to shuffle around and radius02 temporarily became the primary for campus users, which is by far the largest set of users.
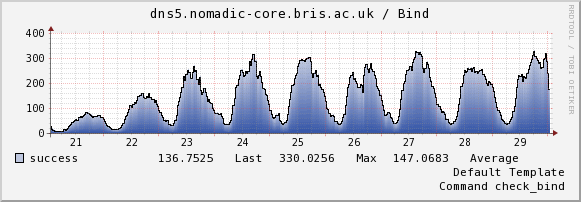
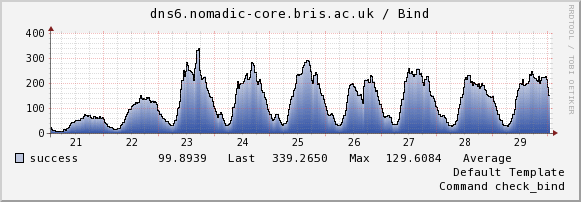
Now for DNS. Pretty self explanatory – these graphs for the two DNS servers show the number of successful queries per second. At peak, times, we serve over 600 lookups per second.
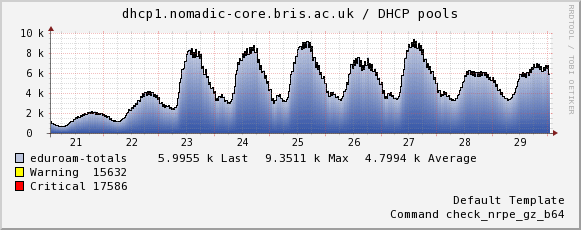
This graph shows the number of valid IPv4 DHCP leases currently in the lease file. We don’t currently graph IPv6 leases so there’s no way of knowing how many there are. Adding this is on my to-do list 🙂
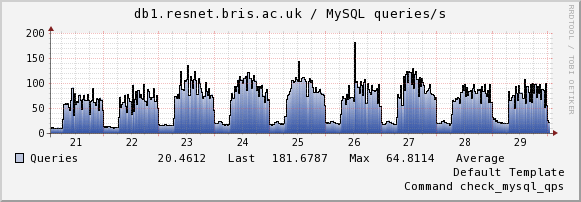
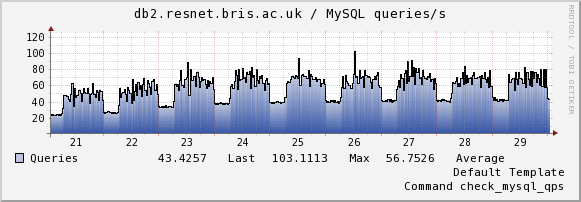
Last but not least, this graph shows the number of queries per second for both nodes in the MySQL cluster that powers eduroam, ResNet and related services. It’s used for authentications, logging and infrastructure management. The two nodes are in a cluster and can rearrange themselves at will, but at any one time, there is one master and one slave. By default db1 is usually the master and handles mostly INSERTs and UPDATEs while db2 is usually the slave and handles only SELECTs.