Building a Gitlab server with Puppet

GitHub is an excellent tool for code-sharing, but it has the major disadvantage of being fully public. You probably don’t want to put your confidential stuff and shared secrets in there! You can pay for private repositories, but the issue still stands that we shouldn’t be putting confidential UoB things in a non-approved cloud provider.

I briefly investigated several self-hosted pointy-clicky Git interfaces, including Gitorious, Gitolite, GitLab, Phabricator and Stash. They all have their relative merits but they all seem to be a total pain to install and run in a production environment, often requiring that we randomly git clone something into the webroot and then not providing a sane upgrade mechanism. Many of them have dependencies on modules not included with the enterprise Linux distributions

In the end, the easiest-to-deploy option seemed to be to use the GitLab Omnibus installer. This bundles the GitLab application with all its dependencies in a single RPM for ease of deployment. There’s also a Puppet Forge module called spuder/gitlab which makes it nice and easy to install on a Puppet-managed node.

After fiddling, my final solution invokes the Forge module like this:

class { 'gitlab' : 
  puppet_manage_config          => true,
  puppet_manage_backups         => true,
  puppet_manage_packages        => false,
  gitlab_branch                 => '7.4.3',
  external_url                  => "https://${::fqdn}",
  ssl_certificate               => '/etc/gitlab/ssl/gitlab.crt',
  ssl_certificate_key           => '/etc/gitlab/ssl/gitlab.key',
  redirect_http_to_https        => true,
  backup_keep_time              => 5184000, # 5184000 = 60 days
  gitlab_default_projects_limit => 100,
  gitlab_download_link          => 'https://downloads-packages.s3.amazonaws.com/centos-6.5/gitlab-7.4.3_omnibus.5.1.0.ci-1.el6.x86_64.rpm',
  gitlab_email_from             => 'gitlab@example.com',
  ldap_enabled                  => true,
  ldap_host                     => 'ldap.example.com',
  ldap_base                     => 'CN=Users,DC=example,DC=com',
  ldap_port                     => '636',
  ldap_uid                      => 'uid',
  ldap_method                   => 'ssl',
  ldap_bind_dn                  => 'uid=ldapuser,ou=system,dc=example,dc=com',
  ldap_password                 => '*********',
}

I also added a couple of resources to install the certificates and create a firewall exception, to make a complete working deployment.

The upgrade path requires manual intervention, but is mostly automatic. You just need to change gitlab_download_link to point to a newer RPM and change gitlab_branch to match.

If anyone is interested, I’d be happy to write something about the experience of using GitLab after a while, when I’ve found out some of the quirks.

Update by DaveG! (in lieu of comments currently on this site)

Gitlab have changed their install process to require use of their repo, so this module doesn’t like it very much. They’ve also changed the package name to ‘gitlab-ce’ rather than just ‘gitlab’.

To work around this I needed to:

  • Add name => 'gitlab-ce' to the package { 'gitlab': ... } params in gitlab/manifests/install.pp
  • Find the package RPM for a new shiny version of Gitlab. 7.11.4 in this case, via https://packages.gitlab.com/gitlab/gitlab-ce?filter=rpms
  • Copy the RPM to a local web-accessible location as a mirror, and use this as the location for the gitlab_download_link class parameter

This seems to have allowed it to work fine!
(Caveat: I had some strange behaviour with whether it would run the gitlab instance correctly, but I’m not sure if that’s because of left-overs from a previous install attempt. Needs more testing!)
Nagios alerts via Google Talk

Every server built by my team in the last 3 years gets automatically added to our Nagios monitoring. We monitor the heck out of everything, and Nagios is configured to send us an alert email when something needs our attention.

Recently we experienced an issue with some servers which are used to authenticate a large volume of users on a high profile service, nagios spotted the issue and sent us an email – which was then delayed and didn’t actually hit our inboxes until 1.5hrs after the fault developed. That’s 1.5hrs of downtime on a service, in the middle of the day, because our alerting process failed us.

This is clearly Not Good Enough(tm) so we’re stepping it up a notch.

With help from David Gardner we’ve added Google Talk alerts to our Nagios instance. Now when something goes wrong, as well as getting an email about it, my instant messenger client goes “bong!” and starts flashing. Win!

If you squint at it in the right way, on a good day, Google Talk is pretty much Jabber or XMPP and that appears to be fairly easy to automate.

To do this, you need three things things:

  1. An account for Nagios to send the alerts from
  2. A script which sends the alerts
  3. Some Nagios config to tie it all together

XMPP Account

We created a free gmail.com account for this step. If you prefer, you could use another provider such as jabber.org. I would strongly recommend you don’t re-use any account you use for email or anything. Keep it self contained (and certainly don’t use your UoB gmail account!)

Once you’ve created that account, sign in to it and send an invite to the accounts you want the alerts to be sent to. This establishes a trust relationship between the accounts so the messages get through.

The Script

This is a modified version of a perl script David Gardner helped us out with. It uses the Net::XMPP perl module to send the messages. I prefer to install my perl modules via yum or apt (so that they get updated like everything else) but you can install it from CPAN if you prefer. Whatever floats your boat. On CentOS it’s the perl-Net-XMPP package, and on Debian/Ubuntu it’s libnet-xmpp-perl

#!/usr/bin/perl -T
use strict;
use warnings;
use Net::XMPP;
use Getopt::Std;

my %opts;
getopts('f:p:r:t:m:', \%opts);

my $from = $opts{f} or usage();
my $password = $opts{p} or usage();
my $resource = $opts{r} || "nagios";
my $recipients = $opts{t} or usage();
my $message = $opts{m} or usage();

unless ($from =~ m/(.*)@(.*)/gi) {
  usage();
}
my ($username, $componentname) = ($1,$2);

my $conn = Net::XMPP::Client->new;
my $status = $conn->Connect(
  hostname => 'talk.google.com',
  port => 443,
  componentname => $componentname,
  connectiontype => 'http',
  tls => 0,
  ssl => 1,
);

# Change hostname
my $sid = $conn->{SESSION}->{id};
$conn->{STREAM}->{SIDS}->{$sid}->{hostname} = $componentname;

die "Connection failed: $!" unless defined $status;
my ( $res, $msg ) = $conn->AuthSend(
  username => $username,
  password => $password,
  resource => $resource, # client name
);
die "Auth failed ", defined $msg ? $msg : '', " $!"
unless defined $res and $res eq 'ok';

foreach my $recipient (split(',', $recipients)) {
  $conn->MessageSend(
    to => $recipient,
    resource => $resource,
    subject => 'message via ' . $resource,
    type => 'chat',
    body => $message,
  );
}

sub usage {
print qq{
$0 - Usage

-f "from account" (eg nagios\@myhost.org)
-p password
-r resource (default is "nagios")
-t "to account" (comma separated list or people to send the message to)
-m "message"
};
exit;

The Nagios Config

You need to install the script in a place where Nagios can execute it. Usually the place where your Nagios check plugins are installed is fine – on our systems that’s /usr/lib64/nagios/plugins.

Now we need to make Nagios aware of this plugin by defining a command. In your command.cfg, add two blocks like this (one for service notifications, one for host notifications). Replace <username> with the gmail account you registered, excluding the suffix, and replace <password> with the account password.

define command {
  command_name notify-by-xmpp
  command_line $USER1$/notify_by_xmpp -f <username@gmail.com> -p <password> -t $CONTACTEMAIL$ -m "$NOTIFICATIONTYPE$ $HOSTNAME$ $SERVICEDESC$ $SERVICESTATE$ $SERVICEOUTPUT$ $LONGDATETIME$"
}

define command {
  command_name host-notify-by-xmpp
  command_line $USER1$/notify_by_xmpp -f <username@gmail.com> -p <password> -t $CONTACTEMAIL$ -m "Host $HOSTALIAS$ is $HOSTSTATE$ - Info"
}

This command uses the Nagios user’s registered email address for XMPP as well as email. For this to work you will probably have to use the short (non-aliased) version of the email address, i.e. ab12345@bristol.ac.uk rather than alpha.beta@bristol.ac.uk. Change this in contact.cfg if necessary.

With the script in place and registered with Nagios, we just need to tell Nagios to use it. You can enable it per-user or just enable it for everyone. In this example we’ll enable it for everyone.

Look in templates.cfg and edit the generic contact template to look like this. Relevant changes are in bold.

define contact{
        name                            generic-contact
        service_notification_period     24x7
        host_notification_period        24x7
        service_notification_options    w,c,r,f,s
        host_notification_options       d,u,r,f,s
        service_notification_commands   notify-service-by-email, notify-service-by-xmpp
        host_notification_commands      notify-host-by-email, notify-by-xmpp
        register                        0
}

Restart Nagios for the changes to take effect. Now break something, and wait for your IM client to receive the notification.

eduroam in Freshers’ Week: Some graphs

This year, eduroam is an interesting service. Not only has it been running on all-new Fog-based infrastructure since the mid-summer, but eduroam and ResNet Wireless have been merged to form one authenticated wireless network to rule them all with more users than ever before.

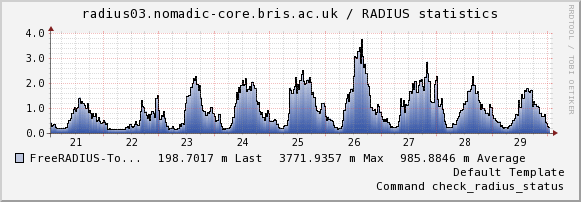
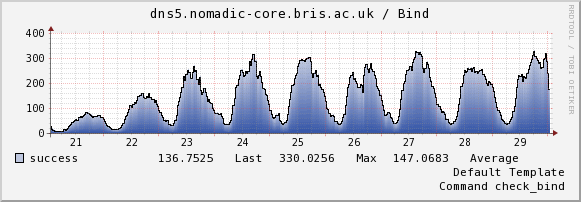
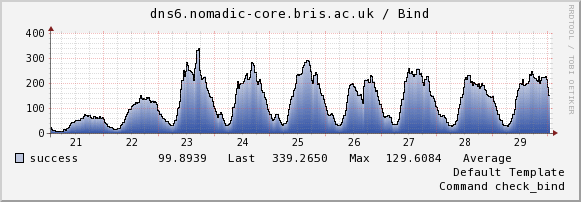
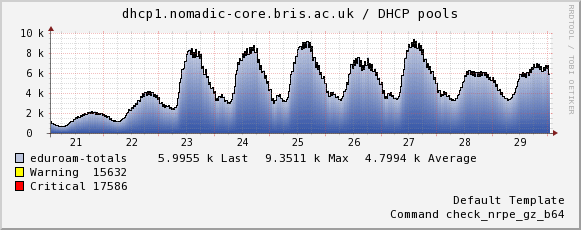
We’ve been watching how the servers are performing under load for the first time with great interest. Let’s have a look at some of the numbers. All of these graphs show the time from midnight on Saturday 21st September (UK freshers arrive) to midnight on Monday 30th September (end of weekend after freshers week).

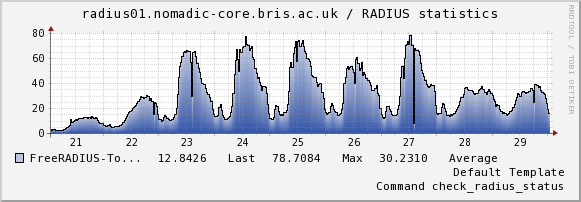
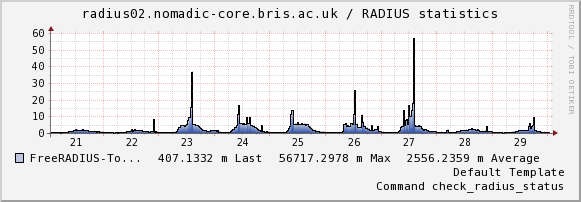
First let’s have a look at the graph of RADIUS authentication requests – scaled to show Access-Request packets received per second (not necessarily authentications per second, as one authentication usually constitutes several Access-Requests).

The gentle swell of users on the weekend of the 28th/29th is mostly undergraduates using eduroam in residences. The taller spikes on weekdays is made up by University staff using eduroam on campus.

radius01 usually serves eduroam users on campus, at Bristol – both Bristol students and visitors from other eduroam institutions. radius02 usually serves Bristol users who are visiting other institutions, while radius03 usually authenticates any user authenticating at eduroam hotspots in Bristol City Council buildings, and certain local hospitals. However the servers have got each other’s backs, and will take on additional roles at will if there’s an outage.

There are a couple of large spikes on the graph of radius02 with matching notches on the graph of radius01. These are times when the servers decided to shuffle around and radius02 temporarily became the primary for campus users, which is by far the largest set of users.

radius01-total-access-challenges
radius02-total-access-challenges
radius03-total-access-challenges

Now for DNS. Pretty self explanatory – these graphs for the two DNS servers show the number of successful queries per second. At peak, times, we serve over 600 lookups per second.

dns5-success dns6-success

This graph shows the number of valid IPv4 DHCP leases currently in the lease file. We don’t currently graph IPv6 leases so there’s no way of knowing how many there are. Adding this is on my to-do list 🙂

dhcp1-eduroam-totals

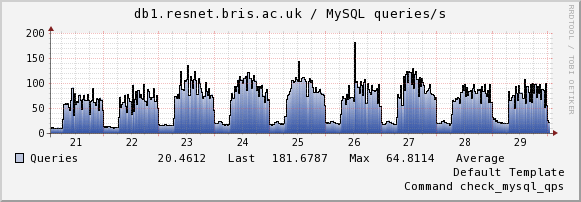
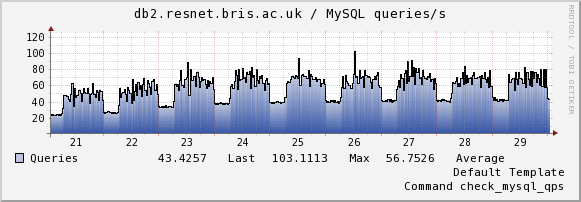
Last but not least, this graph shows the number of queries per second for both nodes in the MySQL cluster that powers eduroam, ResNet and related services. It’s used for authentications, logging and infrastructure management. The two nodes are in a cluster and can rearrange themselves at will, but at any one time, there is one master and one slave. By default db1 is usually the master and handles mostly INSERTs and UPDATEs while db2 is usually the slave and handles only SELECTs.

db1-qps db2-qps

How to use SELinux

SELinux is one of the least well understood components of modern Linux distributions. Search any forum or mailing list and you are likely to find recommendations to switch it off because it “breaks things”. When we decided to migrate the ResNet and eduroam servers from CentOS 5 to 6, we took the decision to move from “SELinux off by default” to “SELinux on by default, and only off where necessary”. Turns out it’s not that hard to configure 🙂

Introduction

Explaining exactly how SELinux works is beyond the scope of this blog post – but suffice it to say that it works by labelling parts of the filesystem, users and processes with a context to say what they are for. It will then block actions it thinks are unsafe – for example, even if your httpd has filesystem permissions to write to /etc/ssh/, by default SELinux would block this action because it isn’t usual. To learn more, have a look at the many web pages about SELinux.

Configuring SELinux

Configuring SELinux to work nicely on your system is best described as “training” it, and is a lot like training a spam filter. You have to look at the SELinux audit log to see what actions were blocked, review them, and then add them to a whitelist by loading a new policy. You can load as many supplementary policies as you need.

Your SELinux installation should always be left in enforcing mode by default. Edit /etc/selinux/config to make sure it is enforcing, but be aware that this needs a reboot to take effect.

# /etc/selinux/config
SELINUX=enforcing
SELINUXTYPE=targeted

When you want to temporarily enable permissive mode, issue the command sudo setenforce 0. This takes effect immediately. Don’t forget to run sudo setenforce 1 to re-enable enforcing mode after you’ve finished debugging.

When you start out configuring SELinux, it’s important to run it in permissive mode, rather than enforcing mode. Let’s say you want to debug an application that wants to perform operations A, B and C, which would all be blocked by SELinux. In permissive mode, the application would be allowed to run, and SELinux logs what it would have blocked had it been in enforcing mode. Operations A, B and C are all logged and can then be added to the policy. In enforcing mode, the application tries operation A, is blocked and often doesn’t even bother trying operations B and C – so they are never logged, and cannot be debugged.

Capturing SELinux audit logs and generating a policy

All SELinux operations are stashed in the audit log, which is in /var/log/audit/audit.log on CentOS by default. The audit log is not hugely easy to read by eye, but you can install the package policycoreutils-python which provides some handy analysis tools.

Assuming you’ve already dropped SELinux into permissive mode, now try executing the operations you wish to debug: might be testing a Nagios plugin, running a new application, or something else. It should succeed as SELinux is permissive, but it will log all the things it would otherwise have blocked.

Run this command, grepping for the process you’re interested in to generate a policy file to grant all those accesses. Be aware of namespacing issues. SELinux comes with a bunch of bundled policies which are called things like nagios and httpd. If you are loading supplementary policies for these things, it’s best to add a prefix like resnet-nagios or sysops-nagios. The default file extension for a text-mode policy is .te.

sudo cat /var/log/audit/audit.log | grep nagios | audit2allow -m resnet-nagios > resnet-nagios.te

Your .te file is more-or-less human readable and you should inspect it to make sure your new policy isn’t going to allow anything bad. Here’s the .te file I generated by running the above command on my Nagios server:

module resnet-nagios 1.0;

require {
  type nagios_system_plugin_t;
  type nagios_t;
  type tmp_t;
  type initrc_tmp_t;
  type nagios_services_plugin_t;
  class file { read ioctl write getattr open append };
}

#============= nagios_services_plugin_t ==============
allow nagios_services_plugin_t tmp_t:file append;

#============= nagios_system_plugin_t ==============
allow nagios_system_plugin_t tmp_t:file append;

#============= nagios_t ==============
allow nagios_t initrc_tmp_t:file { read write getattr open ioctl };
#!!!! The source type 'nagios_t' can write to a 'file' of the following types:
# nagios_var_run_t, nagios_log_t, nagios_tmp_t, root_t

allow nagios_t tmp_t:file { write ioctl read open getattr append };

Loading a custom SELinux policy by hand

Now that we’ve come up with a text-based SELinux policy, it needs to be converted into a binary policy that can be loaded. The command is very similar but note the capital M rather than lower case, which makes it write out a binary policy which has a .pp extension (not to be confused with Puppet manifests ;))

sudo cat /var/log/audit/audit.log | grep nagios | audit2allow -M resnet-nagios

Once you’ve got your binary SELinux module, loading it by hand is easy:

sudo semodule -i resnet-nagios.pp

The CentOS wiki page on SELinux is handy for manipulating policies manually.

Loading a custom SELinux policy with Puppet

There are Puppet modules available which handle the compiling and loading of modules automatically – you just need to provide the .te file and it will handle the rest. For the ResNet and eduroam servers, we are using James Fryman’s puppet-selinux module. It’s not necessarily the best but it was the most appropriate for us at the time we took the decision over a year ago and has worked solidly – other modules are also available. Here’s how we’re using it:

include selinux
if $::osfamily == 'RedHat' {
  selinux::module { 'resnet-nagios':
    ensure => 'present',
    source => 'puppet:///modules/nagios/resnet-nagios.te',
  }
}

Summary

That’s more or less it! It’s easy to set SELinux in permissive mode, capture output and create your own policies. There really is no excuse not to be using it 😉

I hope this article has been useful. If you’re a member of UoB and you want to talk about SELinux or Puppet, grab me on the #uob-unix IRC channel. I’m dj_judas21.

Signing RPM packages

RPM signingI’m sure many Linux sysadmins around the university build RPMs to ease the deployment of software to RedHat-a-like systems. But how many people sign them? Signing is important to make sure your boxes are getting the packages you’re expecting, and allows smoother installation on the box itself. I’ve written a few notes about what we do in the ResNet NetOps team in case they are useful to anyone else. These are loosely based upon some notes hidden in the depths of the ResNet wiki.

Setting rpmbuild up to sign

Before you can sign packages, you need to set up your signing key. There is one key per repo, not per repo maintainer (apparently this is different from apt – I dunno, I’m an RPM guy!). There’s no point in re-inventing the wheel, so use these instructions to get set up with your signing key.

Signing your own packages

If you build your packages either from specfile and tarball, or by rebuilding a source rpm, signing is easy. At the time you build your package, just add the --sign option to sign the RPM with your key. There’s no need to specify whom to sign the package as, because your ~/.rpmmacros file specifies this.

rpmbuild -ba --sign source-1.0.spec
rpmbuild --rebuild source-1.0.srpm

Re-signing someone else’s packages

Often, you’ll need to drag someone else’s third-party RPM into your repo for easy deployment. All the RPMs in your repo should be signed with the same key, regardless of original source. You can sign existing RPMs like this:

rpm --resign package-1.0.rpm