About Paul Seward

Paul is a Linux sysadmin looking after the servers behind the ResNet and eduroam networks, and the main campus DNS infrastructure at the University of Bristol. He's been using unix of one flavour or another for more than 2 decades, and is still constantly surprised by useful commands he didn't know existed.

How old is this solaris box?

Sometimes it’s useful to know how old a solaris server is, without having to dig out its serial number or documentation.

Turns out it’s really easy. “prtfru -c” will give you the build date of various bits of hardware in the system. For example, here’s a server that we’ve just retired (Which is long overdue!)

oldserver:$ sudo prtfru -c | grep UNIX_Timestamp
Password:
      /ManR/UNIX_Timestamp32: Mon Aug 22 02:52:32 BST 2005
      /ManR/UNIX_Timestamp32: Fri Jun  3 19:48:16 BST 2005
      /ManR/UNIX_Timestamp32: Wed Aug  3 11:39:47 BST 2005
      /ManR/UNIX_Timestamp32: Fri Jun  3 19:46:50 BST 2005
oldserver:$ 

Capacity Planning for DNS

I’ve spent the last 6 months working on our DNS infrastructure, wrangling it into a more modern shape.

This is the first in a series of articles talking about some of the process we’ve been through and outlining some of the improvements we’ve made.

One of the exercises we try to go through when designing any new production infrastructure is capacity planning. There are four questions you need to be able to ask when you’re doing this:

  1. How much traffic do we need to handle today?
  2. How are we expecting traffic to grow?
  3. How much traffic can the infrastructure handle?
  4. How much headroom have we got?

We aim to be in a position where we can ask those four questions on a regular basis, and preferably get useful answers to them!

When it comes to DNS, the most useful metric would appear to be “queries/second” (which I’ll refer to as qps from here on in to save a load of typing!) and bind can give us that information fairly readily with it’s built in statistics gathering features.

With that in mind, lets look at those 4 questions.

1. How much traffic do we need to handle today?
The best way to get hold of that information is to collect the qps metrics from our DNS infrastructure and graph them.

This is quite a popular thing to do and most monitoring tools (eg nagios, munin or ganglia) have well worn solutions available, and for everything else there’s google

Unfortunately we weren’t able to collate these stats from the core of the legacy DNS infrastructure in a meaningful way (due to differences in bind version, lack of a sensible aggregation point etc)

Instead, we had to infer it from other sources that we can/do monitor, for example the caching resolvers we use for eduroam.

Our eduroam wireless network is used by over 30,000 client devices a week. We think this around 60% of the total devices on the network, so it’s a fairly good proxy for the whole university network.

We looked at what the eduroam resolvers were handling at peak time (revision season), doubled it and added a bit. Not a particularly scientific approach, but it’s likely to be over-generous which is no bad thing in this case!

That gave us a ballpark figure of “we need to handle around 4000qps”

2. How are we expecting traffic to grow?
We don’t really have long term trend information for the central DNS service due to the historical lack of monitoring.

Again inferring generalities from eduroam, the number of clients on the network goes up by 20-30% year on year (and has done since 2011) Taking 30% growth year on year as our growth rate, and expanding that over 5 years it looks like this:

dns growth

Or in 5 years time we think we’ll need around 15,000qps.

All estimates in this process being on the generous side, and due to the compound nature of the year-on-year growth calculations, that should be a significant overestimate.

It will certainly be an interesting figure to revisit in 5 years time!

3. How much traffic can the infrastructure handle?
To answer this one, we need some benchmarking tools. After a bit of research I settled on dnsperf. The mechanics of how to run dnsperf (and how to gather a realistic sample dataset) are best left for another time.

All tests were done against the pre-production infrastructure so as not to interfere with live traffic.

Lets look at the graphs we get out at the end.

The new infrastructure:
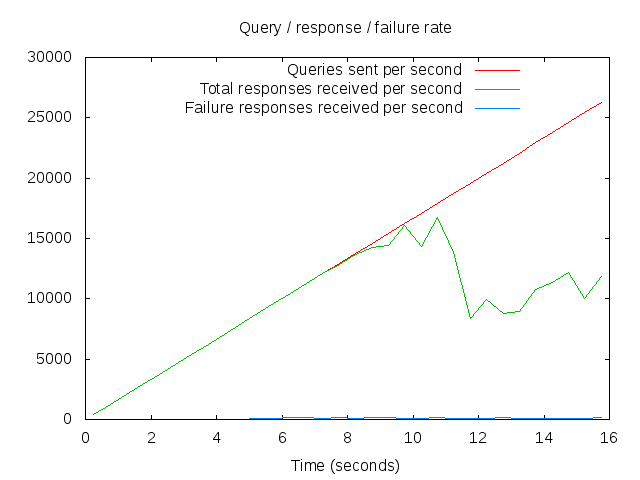
20150624-1225.rate

Interpreting this graph isn’t immediately obvious. The way dnsperf works is that it linearly scales the number of queries/second that it’s sending to your DNS server, and tracks how many responses it gets back per second.

So the red line is how many queries/second we’re testing against, and the green line is how the server is responding. Where the two lines diverge shows you where your infrastructure starts to struggle.

In this case, the new infrastructure appears to cope quite well with around 30,000qps – or about twice what we’re expecting to need in 5 years time. That’s with all (or rather, both!) the servers in the pool available, so do we still have n+1 redundancy?

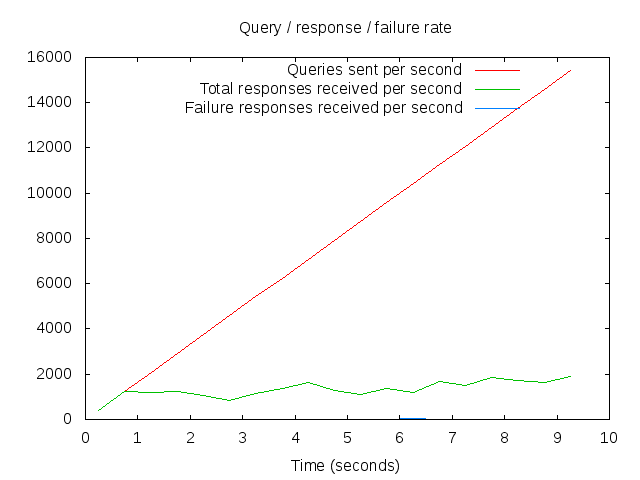
A single node in the new infrastructure:
20150622-1438.rate

From this graph you can see we’re good up to around 14000qps, so we’re n+1 redundant for at least the next 3-4 years (the lifetime of the harware we’re using)

At present, we have 2 nodes in the pool, the implication from the two graphs is that it does indeed scale approximately linearly with the number of servers in the pool.

4. How much headroom have we got?
At this point, the answer to that looks like “plenty” and with the new infrastructure we should be able to scale out almost linearly by adding more servers to the pool.

Now that we know how much we can expect our infrastructure to handle, and how much it’s actually experiencing, we can make informed decisions about when we need add more resources in order to maintain at least n+1 redundancy.

What about the legacy infrastructure?
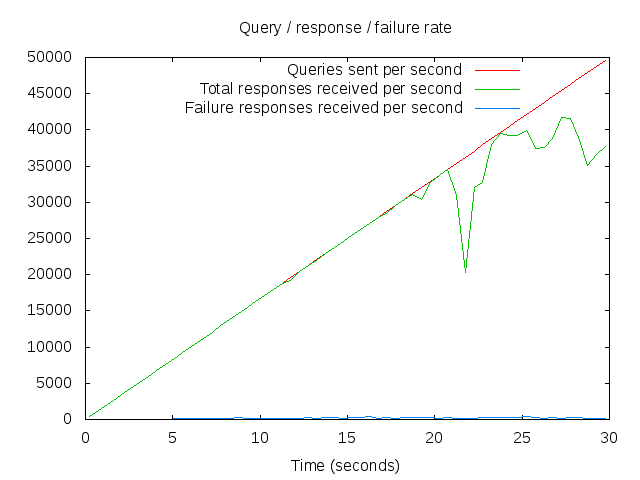
Well, the reason I’m writing this post today (rather than any other day) is that we retired the oldest of the servers in the legacy infrastructure today, and I wanted to fire dnsperf at it, after it’s stopped handling live traffic but before we switch it off completely!

So how many queries/second can a 2005 vintage Sun Fire V240 server cope with?

20150727-0938.rate

It seems the answer to that is “not really enough for 2015!”

No wonder its response times were atrocious…

SELinux quicktip

A while ago, Jonathan wrote a really useful post about how to use SELinux – it’s useful, and I tend to refer to it every time I need to build an SELinux policy to get something working.

However, yesterday I hit a wrinkle not covered in that post. I was working on a nagios plugin which didn’t work when run by nrpe. It worked from the command line, and worked via nrpe with SELinux disabled (which pointed the finger neatly at SELinux) but it didn’t leave any traces in the audit log, which makes building a policy difficult!

It seems that the default policies in CentOS include a list of “don’t audit” rules, which silently block some types of behaviour. The intention is to keep a lot of common noise out of the audit log, but that doesn’t help you much when you’re trying to build a policy!

Luckily you can turn that behaviour on and off.

# Turn it off:
sudo semodule --disable_dontaudit --build
sudo setenforce 0

# Turn it back on:
sudo semodule --build
sudo setenforce 1

With dontaudit disabled, I got the information I needed in the audit log and was able to successfully build a policy that made my nagios check work.

What’s in your history?

A little bit of Friday frivolity for you. A friend of mine recently discovered zsh_history, which tells you what commands you run most often from your shell. Obviously zsh_history is pretty zsh specific, but a bit of rummaging in the code shows it pretty much does this:

history | awk '{CMD[$2]++;count++;}END { for (a in CMD)print CMD[a] " " CMD[a]/count*100 "% " a;}' | grep -v "./" | column -c3 -s " " -t | sort -nr | nl |  head -n10

In my case, on my work desktop my top 10 commands are:

     1	321  32.1%  git
     2	214  21.4%  ls
     3	151  15.1%  cd
     4	105  10.5%  vi
     5	29   2.9%   ssh
     6	29   2.9%   exit
     7	21   2.1%   grep
     8	14   1.4%   less
     9	13   1.3%   nslookup
    10	11   1.1%   whois

Given that git is a key component of the Team ResNet puppet workflow, it’s probably not surprising that it’s top of my list.

If you want to join in, hit us up in the comments and tell us what’s top of your list? Are there any typos which show up more often than you were expecting?

soc::puppet – A puppet themed social event for UoB (Thursday 19th March)

What: soc::puppet is a puppet themed meet up for University of Bristol Staff using, or interested in puppet configuration management  (rather than actual marionettes or glove puppets)
Where: Brambles in The Hawthorns (see the link for details)
When: 5pm-7pm(ish) Thursday 19th March 2015

There’s a growing community of people around the University of Bristol using (or interested in using) puppet configuration management http://puppetlabs.com Some of those people are talking to eachother, and some just don’t know who to talk to yet!

Experience, use case and scale of implementation varies widely, but we’ve all got something to share! 🙂

With that in mind, there seems to be interest in an informal gathering of interested people, where we can get together, share ideas and build a local puppet community.  Bringing together all those informal corridor/tearoom chats and spreading the exciting ideas/knowledge around in a loose, informal manner.

As a first pass, we’ve booked “Brambles” which is the new name for the Staff Club space in The Hawthorns, for a couple of hours after work on Thursday 19th March.  If it goes well, it will hopefully turn into a regular event.

Our initial aim is to make it as informal as possible (hence doing it outside work hours, no pressure to minute it, assign actions, instigate formalised project teams etc) and treat it mostly as an exercise in putting people in touch with other people who are playing with similar toys.

That said, there are a few “bits of business” to take care of at the first meeting, so I’m suggesting the following as a vague agenda.

  1. Welcome!  What’s this about? (about 5 minutes)
  2. Introductions, very quick “round table” to introduce everyone, and say what level of exposure they’ve had to puppet so far (about 10 minutes)
  3. Everything beyond this point will be decided on the day.  If you’ve got something you’d like to talk about or present on, bring it with you!
  4. We’ll close the session with a very quick “should we do this again?” and “call for volunteers”

If people are interested, we can move on to a pub afterwards to continue the discussion.

The facilities available are a bit limited, and apparently the projector isn’t available at the moment, but we’ll see what direction it takes – and as they say in Open Space circles, “Whatever happens is the only thing that could have, be prepared to be surprised!”

DHCP fingerprinting

We wanted to find out what sort of devices are active on the wireless network, and the vendor tools we’ve got don’t quite give us the level of detail we were after.

However, everything which hits our wireless network gets a DHCP lease from our dhcp servers.  With a bit of dhcpd.conf magic, you can make it profile each client when it requests or renews a lease and record a fingerprint in the logs.

dhcpd.conf – collecting fingerprints

# put the dhcp options request fingerprint in the leases file
set dhcp-op-req-string = binary-to-ascii(10,8,":",option dhcp-parameter-request-list);

# log the fingerprint in the format:
# Jul 17 14:36:06 dhcp2 dhcpd: FINGERPRINT 1,3,6,12,15,28 for 00:10:20:30:40:50

log(info,
concat("FINGERPRINT ",
binary-to-ascii(10,8,",",option dhcp-parameter-request-list),
" for ",
concat (  # MAC
        suffix (concat ("0", binary-to-ascii (16, 8, "",
          substring (hardware, 1, 1))),2), ":",
        suffix (concat ("0", binary-to-ascii (16, 8, "",
          substring (hardware, 2, 1))),2), ":",
        suffix (concat ("0", binary-to-ascii (16, 8, "",
          substring (hardware, 3, 1))),2), ":",
        suffix (concat ("0", binary-to-ascii (16, 8, "",
          substring (hardware, 4, 1))),2), ":",
        suffix (concat ("0", binary-to-ascii (16, 8, "",
          substring (hardware, 5, 1))),2), ":",
        suffix (concat ("0", binary-to-ascii (16, 8, "",
          substring (hardware, 6, 1))),2)
       )        # End MAC
));
# End DHCP fingerprinting

Now every time a device interacts with our DHCP server, we get a FINGERPRINT line appearing in our logs along with the mac address which requested the lease.

So far, so good. Now we need to process those logs into something anonymous, but meaningful.

Data Prep
The easiest approach is to cat our logfile, strip out just the fields we’re interested in (mac address and fingerprint) then sort them to remove duplicates (we only want to count each machine once!) and then finally throw away the mac addresses (because all we really want are the fingerprints)

We can do that easily enough with a lovely long pipeline

cat /var/log/dhcpd.log | grep FINGERPRINT | awk '{ print $9 " " $7 }' | sort -u | awk '{ print $2 }'

There are probably more elegant ways to do it, but the above isn’t really the interesting bit. All you get out of it is a list of fingerprints. The magic is in converting those into something meaningful.

Chewing on your fingerprints
To process, identify and count these fingerprints, we need the help of the fingerbank project who have collected DHCP fingerprints from all over the place.

I’m grabbing the fingerprint list as a config file from their github repo: https://github.com/inverse-inc/fingerbank/blob/master/dhcp_fingerprints.conf although since I first started playing with this about 6 months ago, it seems they’ve made their fingerprint database available as an Sqlite DB – which would have been much easier to wrangle than parsing the config file.

So here’s a slightly shonky perl script to parse the config file and produce a CSV summary of the output. This is probably not as elegantly done as it could be, please don’t judge too harshly! I’ve tried to make it readable, but some of the datastructures are a bit on the deep side. If you want to see what’s going on, make plenty of use of “Data::Dumper” – I know I had to when writing it.

It assumes dhcp_fingerprints.conf is in the same folder as the script, and expects to be fed fingerprints over STDIN one line at a time – so you can stick it on the end of the pipeline I mentioned earlier.

#!/usr/bin/perl -wT

use strict;

use Config::IniFiles;
use Data::Dumper;

my %dhcp_fingerprints; # tied version of the config file
my ($fprint_db, $fprint_class, $os_counter); # DStructs which we query later

# Tie fingerprint config file from fingerbank to a DS so we can parse it
tie %dhcp_fingerprints, 'Config::IniFiles', ( -file => "dhcp_fingerprints.conf" );

# Build $fprint_class (maps OS name to "class")
foreach my $class (tied(%dhcp_fingerprints)->GroupMembers("class") ) {
  my ($min,$max) = split /\D/, $dhcp_fingerprints{$class}{"members"};
  $$fprint_class{ $dhcp_fingerprints{$class}{"description"} }{min}=$min;
  $$fprint_class{ $dhcp_fingerprints{$class}{"description"} }{max}=$max;
}

# Build $fprint_db (maps fingerprint to OS name)
foreach my $os ( tied(%dhcp_fingerprints)->GroupMembers("os") ) {
  $os =~ m/os (.*)$/gi;
  my $os_id = $1;

  if ( exists( $dhcp_fingerprints{$os}{"fingerprints"} ) ) {
    if ( ref( $dhcp_fingerprints{$os}{"fingerprints"} ) eq "ARRAY" ) {
      foreach my $dhcp_fingerprint ( @{ $dhcp_fingerprints{$os}{"fingerprints"} } ) {
        $$fprint_db{$dhcp_fingerprint}{"description"}=$dhcp_fingerprints{$os}{"description"};
        $$fprint_db{$dhcp_fingerprint}{"os"}=$os_id;   
      }
    } else {
      if (defined $dhcp_fingerprints{$os}{"fingerprints"}) {
        foreach my $dhcp_fingerprint (split(/\n/, $dhcp_fingerprints{$os}{"fingerprints"})) {
        $$fprint_db{$dhcp_fingerprint}{"description"}=$dhcp_fingerprints{$os}{"description"};
        $$fprint_db{$dhcp_fingerprint}{"os"}=$os_id;
        }
      }
    }
  }
}

# now we loop through all the fingerprints we've been given on STDIN and try to ID them
while () {
  chomp;
  my $fingerprint = $_;

  # See if it appears in $fprint_db...
  if(defined $$fprint_db{$fingerprint}) {
    # Count it
    $$os_counter{$$fprint_db{$fingerprint}{"description"}}{"count"}++;

    # Try to identify the type of OS
    foreach my $class (keys $fprint_class) {
      if ($$fprint_db{$fingerprint}{"os"} >= $$fprint_class{$class}{"min"} && $$fprint_db{$fingerprint}{"os"} <= $$fprint_class{$class}{"max"}) {
        $$os_counter{$$fprint_db{$fingerprint}{"description"}}{"class"}=$class;
      }
    }
    
    # If we haven't yet set the OS class, set it to "unknown"
    $$os_counter{$$fprint_db{$fingerprint}{"description"}}{"class"}="unknown" unless (defined $$os_counter{$$fprint_db{$fingerprint}{"description"}}{"class"});

    } else {
      # No idea what it was, so add it to the unknown count
      $$os_counter{"unknown"}{"count"}++;
      $$os_counter{"unknown"}{"class"}="unknown";
    }
  }

# Print summary output as a CSV
print "\n\nClass,OS,Count\n";
foreach my $os(keys %$os_counter) {
  print qq["$$os_counter{$os}{class}","$os","$$os_counter{$os}{count}"\n];
}

If I let that chew on a decent chunk of todays logs (from about 7am to 2pm) it spits out the following:

Class OS Count
Smartphones/PDAs/Tablets Samsung Galaxy Tab 3 7.0 SM-T210R 39
Home Audio/Video Equipment Slingbox 49
Dead OSes OS/2 Warp 1
Gaming Consoles Xbox 360 6
Windows Microsoft Windows Vista/7 or Server 2008 1694
Printers Lexmark Printer 1
Network Boot Agents Novell Netware Client 1
Macintosh Mac OS X Lion 2783
Misc Eye-Fi Wireless Memory Card 1
Printers Kyocera Printer 1
unknown unknown 40
Smartphones/PDAs/Tablets LG Nexus 5 & 7 1797
Printers HP Printer 54
CD-Based OSes PHLAK 1
Smartphones/PDAs/Tablets Nokia 13
Smartphones/PDAs/Tablets Motorola Android 2
Macintosh Mac OS X 145
Smartphones/PDAs/Tablets Generic Android 2989
Gaming Consoles Playstation 2 1
Linux Chrome OS 39
Linux Ubuntu/Debian 5/Knoppix 6 5
Routers and APs Cisco Wireless Access Point 69
Linux Generic Linux 7
Linux Ubuntu 11.04 21
Windows Microsoft Windows 8 1792
Routers and APs Apple Airport 2
Routers and APs DD-WRT Router 3
Smartphones/PDAs/Tablets Sony Ericsson Android 1
Linux Debian-based Linux 51
Smartphones/PDAs/Tablets Symbian OS 2
Storage Devices LaCie NAS 27
Windows Microsoft Windows XP 30
Smartphones/PDAs/Tablets Android Tablet 24
Monitoring Devices Tripplite UPS 1
Smartphones/PDAs/Tablets Apple iPod, iPhone or iPad 12289
Smartphones/PDAs/Tablets Samsung S5260 Star II 2
Smartphones/PDAs/Tablets RIM BlackBerry 63

I’m not sure I 100% believe the above (OS/2 Warp? Really?) but the bits I disbelieve are largely in the noise.

Chewing on the above stats a bit, shows us that the wireless network is roughly 27% laptops and 72% mobile devices (tablets etc). Amongst the laptops, Windows is just about in the lead with 53%, and OSX is close behind at 44% (which is probably higher than a lot of people think) Linux laptops are trailing behind at only 2%.

The mobile device landscape is less evenly split, with 71% iOS and 28% Android.

Although I wouldn’t read too much into the above analysis, as it represents a comparatively small time slice (and only 23775 of the 37000 devices we see on the wireless each week)

Who knows, perhaps we’ve got 13K windows phones owned by people who just don’t come onto campus on a Monday…

Update 2015-05-11: I’ve been asked under what license I’ve released the perl script in this post. I didn’t put any thought into licenses at the time (I was just trying to solve a problem and answer a question I’d been asked!) but I’ll put my hand up, part of the script is based on prior-art.

The section which parses the fingerprint database is taken from the process_fingerprints() function in https://github.com/inverse-inc/fingerbank/blob/master/obsolete/tools/fingerprint-find-candidate-matches.pl – a script which seems to be covered by the GPLv2 licence.

As I understand it, under the terms of the GPLv2 license, that means that the script above should also be distributed under the GPLv2 license (which I’m OK with) and that under the terms of that license it should be distributed along with a copy of the GPLv2 license… which can be found here: https://www.gnu.org/licenses/gpl-2.0.html

The end of the PPTP VPN

vpn_gravestone

In September 2013 IT Services launched a new VPN service, based around Junos Pulse. This replaced the older PPTP based service, but the two ran in parallel for 9 months to give people a chance to transition.

On 30th June 2014 08:45, the PPTP VPN was switched off, ending 12 years of PPTP VPN use at the University of Bristol.

The story starts not with a VPN, but with wireless networking…

In 2001, Bristol dipped its toe into wireless networking, and started work on the “Nomadic Network”

Wireless technology was still young, and wireless encryption wasn’t widely supported on client devices. So Nomadic used an open, unencrypted SSID with restricted routing. The only thing you could get to was a bank of PPTP VPN concentrators, referred to as “roamnodes”

These roamnodes were cheap commodity x86 boxes with no disk.  They booted a custom linux live CD which held its config on a floppy disk.  This made upgrades/rollback really easy (pull out the CD, put the new one in, reverse process to revert)

The idea was that you connected to the wireless (or plugged your laptop in to one of the public network sockets, and connected to the access network via PPPoE), then span up a VPN connection to get on the university network.

That all sounds a bit clunky these days, but back then it was sophisticated enough that several other universities around the UK picked up the system – and we won the UCISA Award for Excellence in 2003. (Which caused a certain amount of amusement in the office at the time. They managed to misspell “Excellence” on the oversized novelty presentation cheque!)

As a VPN was an integral part of the Nomadic Network, it was convenient to use the same technology to provide off-site access to UoB restricted resources (as anyone using the wireless already had the client configured)

By 2005 wireless technology had moved on and work started to replace the Nomadic Network with a wireless system which eventually evolved into the eduroam service we have today.

Although the wireless no-longer had need of a VPN component, the VPN was retained and rebuilt as a stand alone service. The service had a refresh in 2007 to upgrade it to CentOS 5 – and it’s been running the same OS, on the same hardware ever since.

That hardware is long since out of extended hardware maintenance (and both of the remaining nodes have known hardware issues) client support for PPTP is now patchy and difficult to debug, it’s not compatible with a lot of home broadband routers, some major ISPs actively block PPTP and finally, the encryption used in our implementation had some weaknesses which we’d really rather it hadn’t! (although we have no evidence that those weaknesses were ever exploited)

So that’s why we’ve replaced it!

In some ways, I’m sorry to see it go as it’s one of the services I was initially employed to support. In many other ways though, it’s done its job and been surpassed by other technology. Maintenance and support of the service had become problematic. It’s time to move on.

For a service with approximately 500 users a month, it needed a surprising number of resources to keep it going.

Now that it’s gone we can shut down 2 physical PPTP head nodes, 5 unmanaged virtual linux servers which provide supporting services (authentication, dhcp, dns, web redirects etc) and 2 hypervisors which are also out of hardware maintenance.

The new Junos Pulse VPN is a single appliance. Much more efficient on rack space, power and cooling!

Juniper VPN – official Linux instructions

After much effort, we now have a packaged version of the Juniper VPN Linux client available! We also have a helper script which allows you to easily connect from your Linux desktop. It’s available for rpm and deb based distros, and as a tgz if you’re using a different package manager.

The instructions have been published here: http://www.bris.ac.uk/it-services/advice/homeusers/uobonly/uobvpn/howto/linux/

The old PPTP based VPN will be switched off on the 30th June 2014 and anyone using linux to VPN in will need to migrate to the new service before then.

-Paul

What’s talking to my DNS server?

I currently look after 6 DNS resolvers, which are used to provide DNS two large sections of the university network.

While they’re all running BIND, there’s a real mix of versions so I want to consolidate them down, retire the oldest pair and generally tidy up.

The two oldest are in an IP address range that I can’t easily move onto any of the other servers, so any clients using them need to be pointed at the newer servers before I can retire them.

The problem is, I’m not 100% sure which clients are using them.

So, how do you find out what machines are using a given DNS server?
The temptation is to turn on querylogging, and then look at the log files after a week. There are two problems with that, the first is a technical issue (querylogging appears to block responses while waiting for the logging IO to happen, slows your DNS server down significantly and sends the load average through the roof) but the second (more important) problem is a privacy issue.

Querylogging logs every DNS request made by your clients, as well as the IP the client machine is using. Taken together, those two pieces of information are enough to identify what a given user is looking at on the internet. That’s a pretty serious breach of privacy, needs signoff from on-high and is generally a world of paperwork and hastle which is best avoided.

So we need an approach which is lightweight, and only identifies the machines which are talking to us and not what they’re asking for. Gathering the minimum of data required to allow us to make the decision we’re interested in.

On Linux, that’s pretty easy to arrange with a bit of tcpdump and some good old awk:

#!/bin/bash
/usr/bin/nohup /usr/sbin/tcpdump -ln port 53 2>&1 | awk '/\.domain:/ { print $3; system("") }' | awk -F'.' '{ print $1"."$2"."$3"."$4; system("") }' > /tmp/dns_clients.log &

What does that do then?
It’s quite a long pipeline, so if we split it into chunks, it looks a bit like this:

/usr/bin/nohup

nohup combined with the ‘&’ at the end runs the whole pipeline in such a way that it doesn’t die when you log out. Which is useful if you want to set something running and then come back to it later.

/usr/sbin/tcpdump -ln port 53 2>&1

We then use tcpdump to dump all traffic on port 53 (DNS) The -n tells it to not resolve any IP addresses to dns names, and the -l changes the STDOUT buffering to be line buffered. This is helpful if you want to be able to see clients hitting your box in real time, for example to make sure the script is doing what you’re expecting it to.

“2>&1” merges STDERR and STDOUT into a single STDOUT stream.

awk '/\.domain:/ { print $3; system("") }'

Next we awk to look for lines which contain the string “.domain:” these are the ones which are headed towards our DNS server, rather than outbound requests made by processes running on the server. “print $3” prints the third field on the line (which is the source IP address/port of the request)

system(“”) is a useful bodge which makes the output from awk line buffered, in the same way as we used -l for tcpdump.

awk -F'.' '{ print $1"."$2"."$3"."$4; system("") }'

A bit more awk to strip off the port number, leaving us with just the IPv4 address. The observant amongst you will notice that this does nothing for IPv6 addresses. I should probably come up with a better solution, but this is sufficient for the boxes I’m currently interested in.

> /tmp/dns_clients.log &

redirects all the output into the /tmp/dns_clients.log file.

Handling the log file
So set that running on a DNS server, and client IP addresses will be logged to /tmp/dns_clients.log without logging what they’re looking at or slowing down the server too much. However, it logs one line for every request so it can get large quite quickly on a busy server.

I’ve been rotating that logfile out daily and running it through “sort -u” to get a list of unique clients. Once I’ve tracked them all down and pointed them at a more appropriate DNS server I’ll be able to retire the old ones.

Win!

Solaris Bonus Round
If you need to do this on solaris, tcpdump isn’t generally available (unless you’re willing to build it yourself) but /usr/sbin/snoop has roughly equivalent functionality. The output format is a little different, although it’s a bit easier to handle.

#!/usr/bin/bash
/usr/bin/nohup /usr/sbin/snoop -r dst port 53 | awk '{ print $1 }' > /tmp/dns_clients.log &

That does broadly the right thing. It includes traffic originated by the server as well as traffic hitting it from clients (so you could also pipe it through “grep -v $MY_IP” to weed that out if you wanted)